Command Palette
Search for a command to run...
The U.S. Geological Survey Has Proposed the DAS Earthquake Early Warning Model, Which Uses 4-second P-wave Strain Data to Rapidly Classify Moderate to Strong earthquakes.

After an earthquake, the faster-propagating P-waves arrive first, followed by the more destructive S-waves and surface waves. Earthquake early warning systems utilize this time difference to issue alerts before the strong tremors arrive. Although the warning window is typically only a few seconds to tens of seconds, it is sufficient to support public evacuation, reduce the speed of rail transit, and shut down critical facilities, making it an important means of mitigating earthquake damage.
Current systems, exemplified by the US-based ShakeAlert, primarily rely on dedicated seismic stations to capture seismic signals and estimate epicenter location and magnitude. While this method is relatively mature in densely networked terrestrial seismic networks, it faces significant limitations in high-risk nearshore areas such as the Cascadia subduction zone. The high cost of constructing and maintaining seabed stations, coupled with difficulties in real-time communication, has resulted in a prolonged lack of effective monitoring in some nearshore areas. These observational gaps not only compress warning times in coastal regions but may also affect magnitude estimations due to epicenter location inaccuracies.
Distributed Acoustic Sensing (DAS) offers new possibilities for filling this gap. **DAS can utilize existing communication optical cables to transform ordinary optical fibers into a continuously distributed strain sensing array, thereby obtaining high-density seismic wave observations.**However, optical cables are mostly laid linearly, providing limited azimuth information and making it difficult to stably locate the epicenter; at the same time, DAS records strain or strain rate, which is different from the velocity, acceleration and displacement recorded by traditional seismographs.
To address these issues, a research team from the U.S. Geological Survey bypassed the traditional approach of "locating the earthquake first and then estimating its magnitude" and proposed a binary magnitude classification method based on machine learning.**This method uses only the strain waveform within 4 seconds after the first arrival of the P wave to quickly determine whether an earthquake has reached the warning threshold of M5.4 by using amplitude and multi-band wavelet characteristics.**The model was trained using historical borehole strain gauge data and validated on independent DAS data including the M7.0 earthquake off the coast of Cape Mendocino in 2024, providing a new feasible path for DAS to participate in nearshore earthquake early warning.
The relevant research findings, titled "Rapid earthquake magnitude classification via P-wave strains from borehole strainmeters and Distributed Acoustic Sensing," have been published in Nature Communications.
 View the paper:
https://www.nature.com/articles/s41467-026-72223-z
Dataset: Seismic waveform records fusing borehole strain and distributed acoustic sensing
This study uses two types of strain data. Among them,Borehole strain gauge data is used for model training and internal testing, while distributed acoustic sensing (DAS) data is used to verify the model's applicability in communication fiber optic cable scenarios.
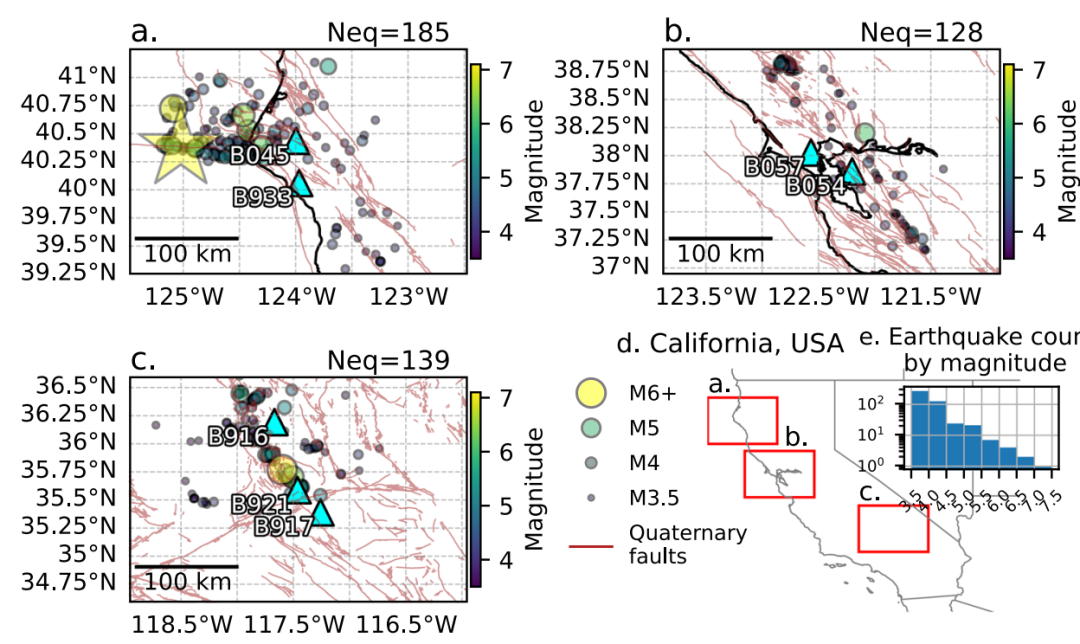
Borehole strain gauge data were obtained from the EarthScope open-source observation network, covering three seismically active areas: the Mendocino Triad Point, Napa Valley, and Ridgecrest in California. The data includes observation records from seven stations from 2008 to 2022. Each station had a sampling rate of 20 Hz and four horizontal strain channels. After filtering, manual P-wave picking, and quality screening, 1949 valid waveforms corresponding to 453 earthquakes were ultimately obtained, ranging in magnitude from M3.5 to M7.1. Waveforms of M5.4 and above accounted for only about 51 TP3T, indicating a significantly uneven sample distribution.
XGBoost binary classifier identifies moderate to strong earthquakes from early P waves.
**This study uses XGBoost gradient boosting trees to construct a binary classification model.**The model determines whether the strain waveform originates from an earthquake of M5.4 or higher. Instead of directly estimating the specific magnitude, it focuses on the most critical issue for early warning systems: whether the earthquake has reached a scale requiring an alert. XGBoost progressively corrects prediction errors using multiple decision trees, simultaneously handling features such as amplitude, frequency, and time-frequency variations, and identifying their nonlinear relationships with earthquake magnitude. Its regularization mechanism also helps reduce the risk of overfitting under small sample conditions.
Since waveforms of M5.4 and above only account for 51 TP3T of all samples, model training faces significant class imbalance. To avoid the model overly favoring small tremors,**The study increased the training weights for moderate-to-strong earthquake samples and optimized them using a bivariate logarithmic loss function.**The focus should be on reducing the number of minor earthquakes that are mistaken for dangerous major earthquakes.
Data is divided into a 70% training set and a 30% test set, but is presented in units of complete earthquake events. All waveforms generated by the same earthquake can only be included in one set to avoid similar data appearing in both the training and testing phases.**The study also imposed constraints on the number of large earthquake samples in the training set and selected 50 independent models that met the criteria from approximately 2,000 random partitions.**This is to reduce the randomness caused by a single partition.
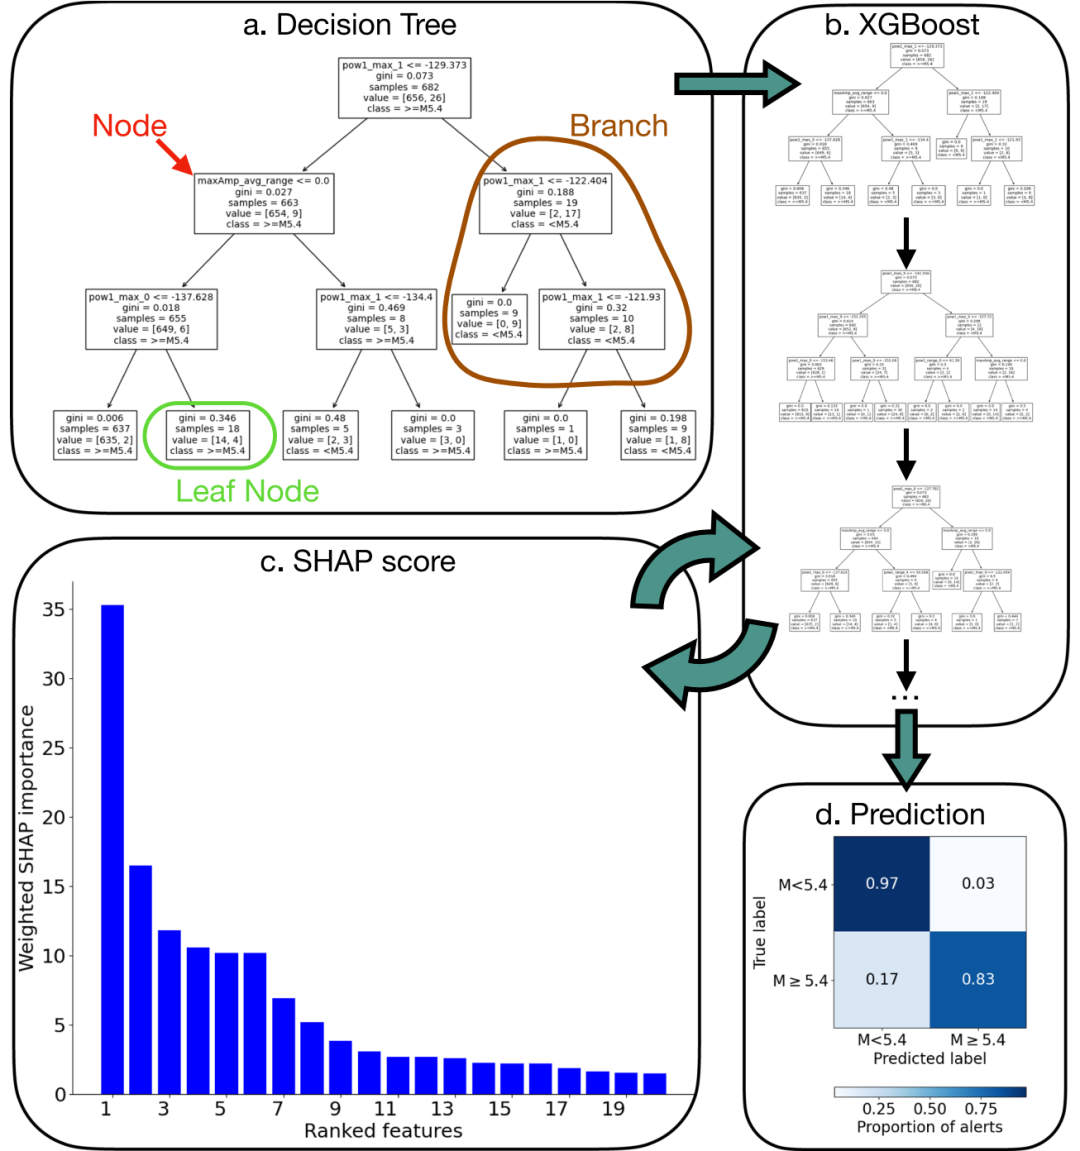
Considering the high correlation of some features, the study further eliminated redundant information, ultimately retaining three core features: the maximum value of the third-order Gaussian wavelet coefficients in the 0.2-0.5Hz band, the range of the first-order Gaussian wavelet coefficients in the 0.5-2.0Hz band, and the maximum strain amplitude within 4 seconds after the arrival of the P-wave. These three features reflect low-frequency energy, mid-to-low-frequency variation amplitude, and strain intensity, respectively. Their low correlation preserves the main discriminative information and makes the model's prediction basis clearer.
After identifying the core features, we studied retraining the model and compared the recall, precision, and F1 score under different training epochs.**The results showed that after 500 rounds of training, all indicators were basically stable.**Therefore, the final performance is taken as the average result of 500 models to reduce the fluctuations caused by data partitioning and random training.
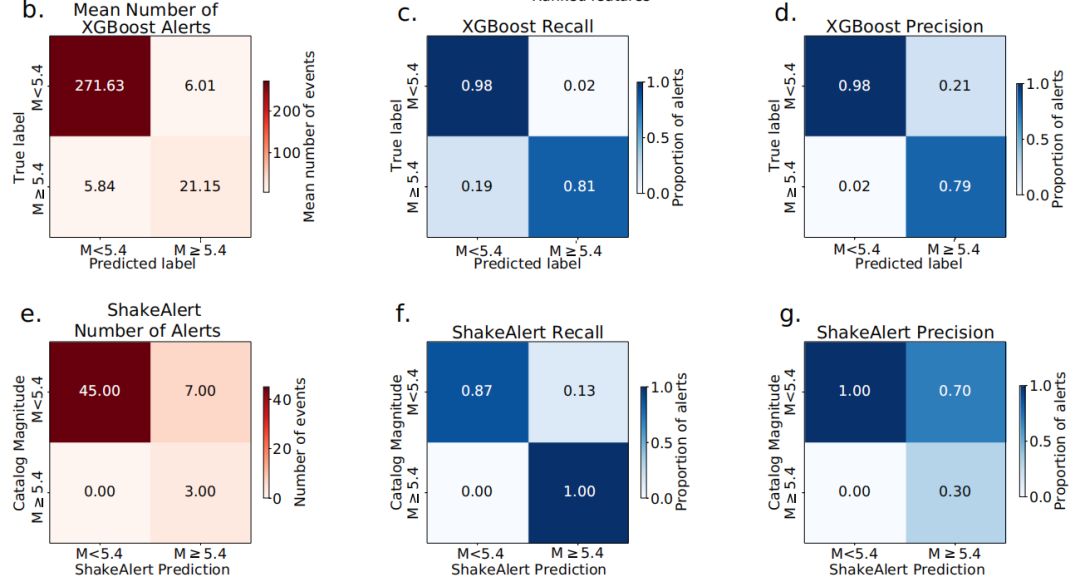
The model achieved a recall of 81% and a precision of 79% on borehole strain gauge data.
Next, the researchers conducted experiments in four areas: model classification ability, reference comparison with ShakeAlert, DAS cross-device validation, and static strain analysis.
first,**Based on the borehole strain gauge data, the overall accuracy of the model reached 96%.**However, since minor earthquakes account for 951 TP3T of the sample, this indicator is prone to being inflated. Recall, precision, and F1 score are more meaningful. The average recall of the 500 models was 811 TP3T, the average precision was 791 TP3T, and the F1 score was 781 TP3T. This indicates that the model can identify more than 80% of moderate to strong earthquakes and maintains a relatively balanced distribution between missed and false alarms.
Secondly, the study retrospectively compared the model with historical results from ShakeAlert. The two models operate under different conditions: the model in this paper uses data from a single strain gauge and does not require epicenter location; ShakeAlert, on the other hand, relies on at least four seismic stations and requires real-time detection, location, and magnitude estimation. Therefore, the comparison results can only be used as a reference.
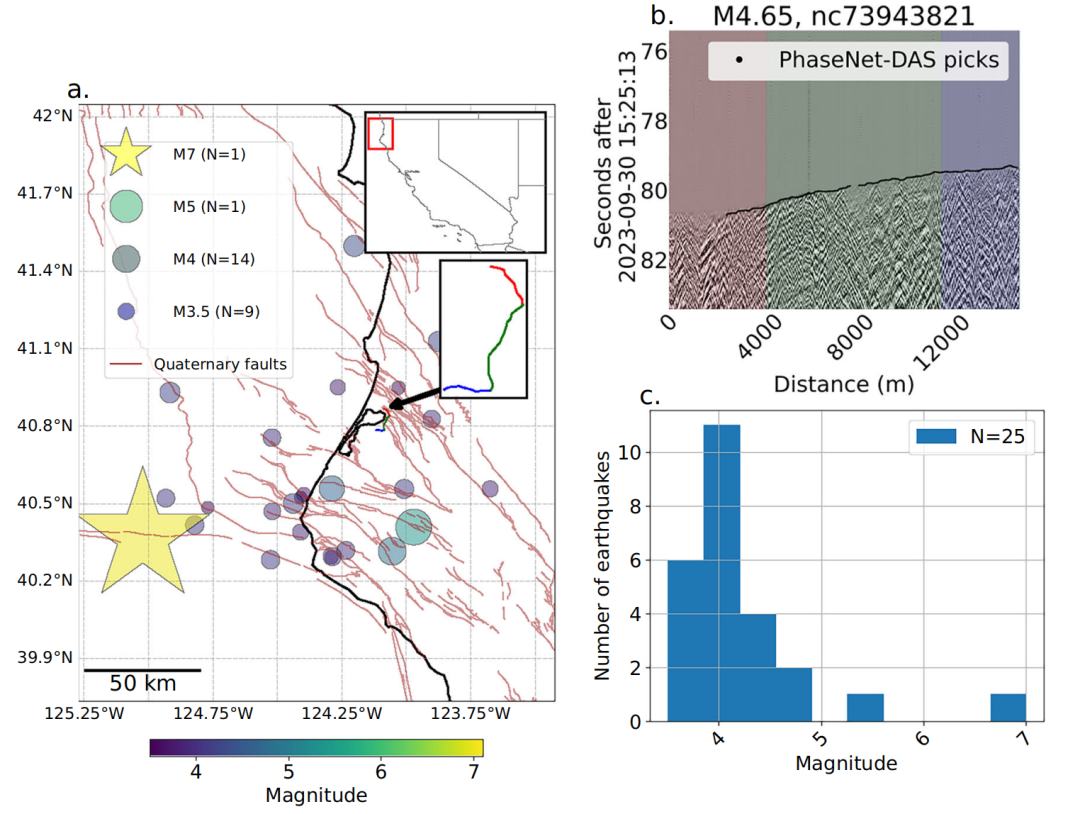
The third set of experiments tested whether the model could be transferred to DAS data. The study divided the 15-kilometer optical cable into three sections and extracted the characteristic mean and standard deviation of the effective channels in each section. The results showed that although DAS and borehole strain gauges differed in terms of installation conditions, site effects, and frequency response, the core characteristics showed a basically consistent trend with magnitude and did not exhibit significant regional dependence.
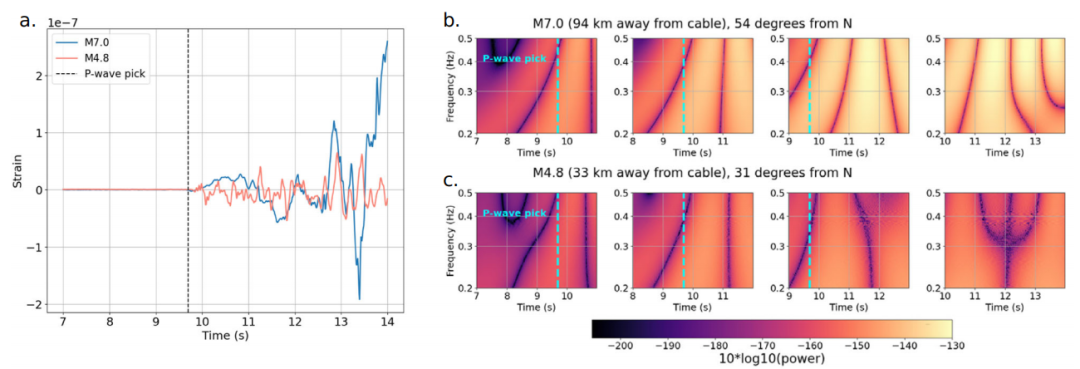
The M7.0 earthquake off Cape Mendocino in 2024 was not used in model training. Its borehole strain gauge waveform was correctly identified as M5.4 or higher by all 500 models. After inputting the features of three DAS fiber optic cables into the model, the average recall reached 961 TP3T. The results indicate that the model trained based on borehole strain gauges possesses a certain degree of cross-device transferability.
Further comparison between the M7.0 earthquake and a M4.8 earthquake revealed that both had similar strain amplitudes in the initial P-wave phase. However, the M7.0 earthquake exhibited significantly stronger energy and a longer duration in the 0.2-0.5 Hz frequency band. This indicates that low-frequency characteristics can more effectively reflect the prolonged rupture process of large earthquakes and are an important basis for models to complete magnitude classification.
Final Thoughts
Overall, this study did not attempt to completely replicate the traditional earthquake early warning process using DAS, but instead redesigned how DAS is used: skipping the epicenter location step, which is easily affected by the shape of the optical cable, and directly using the strain characteristics within 4 seconds after the arrival of the P wave to determine whether the earthquake has reached the warning threshold.
This method reduces reliance on the number of stations, fiber optic cable orientation, and precise source location, and also partially circumvents the magnitude estimation challenges arising from the differences in physical quantities observed by DAS and traditional seismographs. Although there is still room for improvement in model recall, and validation has currently been primarily conducted on onshore DAS data, the study has demonstrated that low-frequency and amplitude information in strain waveforms can be used to quickly identify moderate to strong earthquakes.
With the further opening of submarine communication optical cables, the decrease in the cost of DAS equipment, and the accumulation of marine observation data, DAS is expected to become an important supplement to traditional seismic networks. In high-risk areas such as the Cascadia subduction zone, where nearshore stations are sparse and coastal populations are dense, it may serve as a front-line monitoring network, detecting potential major earthquakes earlier and providing coastal areas with additional warning time.