Command Palette
Search for a command to run...
The LDBC Financial Benchmark: Transaction Workload
The LDBC Financial Benchmark: Transaction Workload
Abstract
Graph databases play a pivotal role in the FinTech industry. However, existing graph benchmarks fail to capture the unique characteristics of financial datasets and workloads, rendering them inadequate for evaluating graph databases in financial scenarios. This paper presents the LDBC Financial Benchmark (FinBench) Transaction Workload, a novel benchmark that adopts a choke point-driven design methodology, emphasizing performance bottle necks, and incorporates distinct features such as dataset skewness, edge multiplicity, temporal window filtering, recursive path fil tering, read-write query patterns, and truncation on hub vertices. Key contributions include a scalable data generator that synthesizes datasets with financial-specific features, a parameter generator that leverages bucketed data statistics for runtime consistency across queries, and a scalable benchmark driver that biases query execution by time windows. Experimental evaluations on graph databases demonstrate the benchmark's capability to reveal novel choke points and provide insights into system performance in fi nancial scenarios.
One-sentence Summary
Ant Group, CreateLink Technology, HKUST(GZ) et al. propose FinBench Transaction Workload, a graph database benchmark for financial scenarios built on a choke point-driven design methodology that incorporates features such as dataset skewness, edge multiplicity, temporal window filtering, and recursive path filtering to reveal novel performance bottlenecks missed by existing benchmarks.
Key Contributions
- The paper introduces the LDBC Financial Benchmark (FinBench) Transaction Workload, an LDBC-style graph-database benchmark for financial workloads that uses a choke point-driven design to model dataset skewness, edge multiplicity, temporal window filtering, recursive path filtering, read-write query patterns, and hub vertex truncation.
- It contributes a scalable data generator for synthesizing financial-specific graph datasets and a parameter generator that uses bucketed data statistics to maintain consistent runtime behavior across queries.
- Experimental evaluations on graph databases show that a scalable benchmark driver biased by time windows exposes novel choke points and provides insights into graph-database behavior under financial workloads.
Introduction
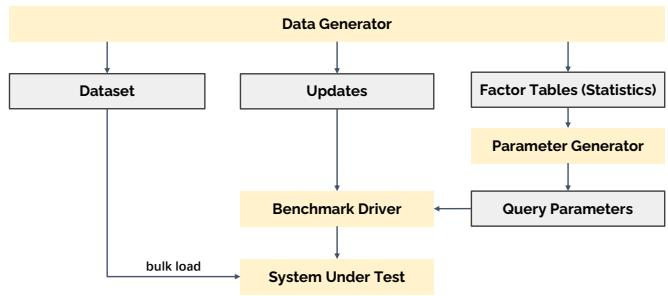
Graph technologies are increasingly used in financial services to model payments, accounts, entities, and relationships for fraud detection, anti-money laundering, and know-your-customer workflows. The authors explain that financial graphs differ from social graphs because they contain multiple transfer edges between account pairs, rich temporal features, and queries that combine time windows, recursive paths, subgraph matching, and read-write operations. This matters because the global payments industry processes trillions of transactions, so graph databases need evaluation methods that reflect real financial data patterns and query bottlenecks. They argue that existing graph benchmarks, especially social-network-oriented benchmarks such as SNB and LinkBench, do not capture these temporal, path-heavy, and transactional characteristics, making them less effective for financial workloads. To address this, the authors introduce the LDBC Financial Benchmark (FinBench) Transaction Workload, with a scalable financial data generator, a parameter generator based on dataset statistics to stabilize query runtime, a time-aware benchmark driver, and a workload centered on financial choke points.
Dataset
-
The authors use a financial graph benchmark generated from schemas and statistical characteristics observed in Ant Group financial graphs and client graphs. Artifacts, including code and data, are available at https://github.com/ldbc/ldbc_finbench_transaction_impls.
-
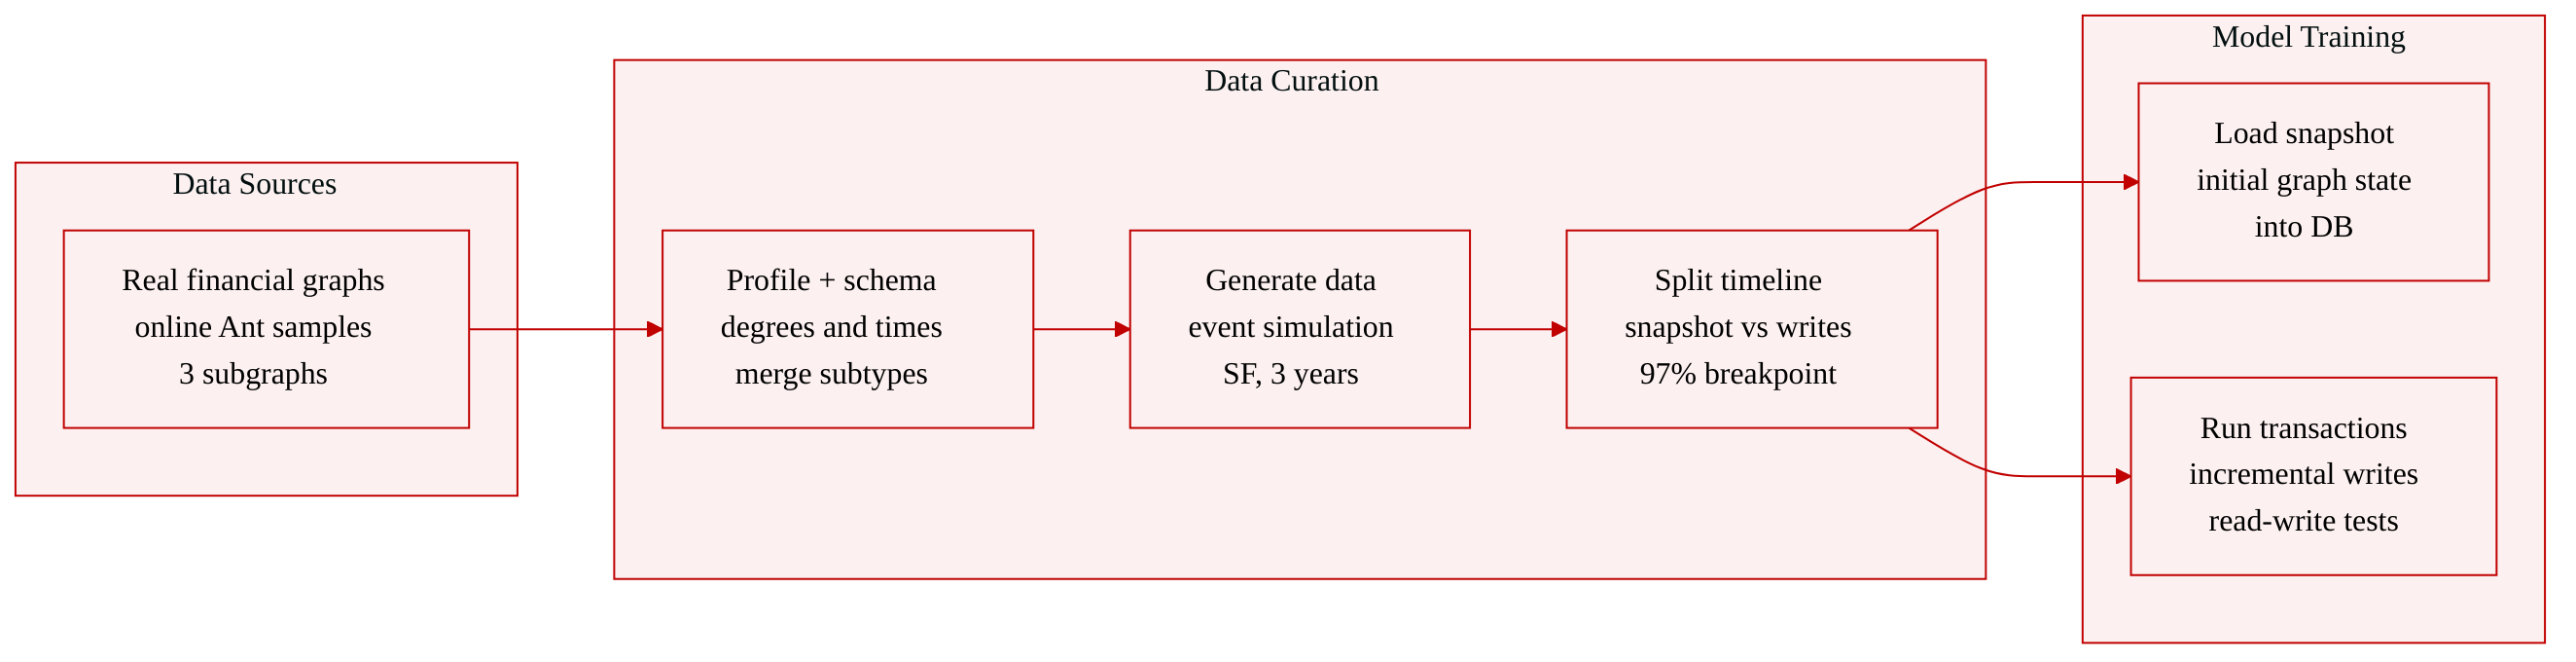
Source data are not published as raw customer records. The authors profile real financial graphs by uniformly sampling three subgraphs from an Ant Group online production environment, then abstract recurring entity types and relationship patterns to design the benchmark schema.
-
The dataset is modeled as a directed financial graph. The schema contains five vertex types and nine edge types, covering persons, companies, accounts, media devices, and relationships such as ownership, sign in, transfer, deposit, withdraw, repay, guarantee, and invest. Similar real world subtypes, such as corporate and individual accounts, are merged into unified vertex types.
-
Edges and vertices carry rich metadata such as creation timestamps, transfer amounts, and annotations. Edge multiplicity is explicitly modeled for signIn, transfer, withdraw, deposit, and repay, allowing multiple edges between the same source and destination. Other edge types do not allow multiplicity.
-
Real world profiling identifies three key dataset characteristics:
- Degree distribution: transfer in-degree and out-degree follow power laws. Most accounts have fewer than ten transfers, while hubs can have millions, with degrees up to 150 million observed.
- Edge multiplicity: hub vertices show skewed multiplicity, where most neighbors have low multiplicity but a few have very high multiplicity.
- Timestamp distribution: transfer activity shows periodic peaks, especially around 8:00 to 9:00 and around mealtimes, with low activity from midnight to early morning.
-
These profiling results become generator parameters. The benchmark generator approximates the degree, edge multiplicity, and timestamp distributions of the sampled real financial graphs.
-
The generated benchmark uses scale factors to control dataset size. For example, SF1 targets a 1 GiB dataset on disk. Statistics for other scale factors are reported in Appendix B, Table 7. The default simulation period is three years, and entity counts scale proportionally with the target dataset size.
-
Dataset construction follows an event-based simulation framework. The generator first creates persons and companies, then simulates account registration, media sign in, investments, loan applications, and fund transfers. Vertices and edges are recorded during these events and written to disk.
-
The generator assigns target degrees to account vertices before fund transfers. If a target degree exceeds a threshold, the account is treated as a hub and its neighbor edge multiplicities are sampled from the configured multiplicity distribution. Edge timestamps are generated according to the observed temporal pattern.
-
The raw simulated data is segmented into two benchmark subsets:
- Snapshot data: the initial graph state loaded into the system under test.
- Incremental data: later events converted into write queries used by the benchmark driver.
-
The default segmentation breakpoint is the 97th percentile of the simulation timeline. This gives a large stable initial snapshot while reserving the final portion for dynamic write and read-write workload testing.
-
No cropping strategy is described in the provided text. The main data selection and processing steps are uniform vertex sampling for profiling, schema abstraction, distribution guided generation, and timeline segmentation.
-
Vertex and edge creation timestamps generated during simulation are mapped to relative timestamps for benchmark queries. During evaluation, the driver uses a time compression coefficient to compute actual request times from these relative timestamps.
-
The dataset is used for graph database benchmarking rather than model training. The snapshot serves as the initial database state, and the incremental data drives financial transaction queries that test storage, traversal, and high-concurrency read-write behavior.
Method
Benchmark Methodology
The authors build the benchmark around a schema-driven data generator and a choke-point-driven transaction workload. The generator is designed to produce realistic financial graphs without exposing sensitive data. It first simulates financial activities over a configurable period, then segments the resulting raw events into an initial snapshot graph and an incremental stream. This two-step design decouples stable graph state from dynamic workload replay. During simulation, the system creates persons, companies, accounts, media devices, and relationships in an order that follows business causality. It then simulates account registration, media sign-ins, investments, loan applications, and fund transfers. Vertex and edge creation is recorded event by event and written after the simulation completes. Entity counts are scaled proportionally to the requested dataset scale, while degree distribution, edge multiplicity, and edge timestamp distribution are configured to approximate real financial graphs. For example, the generator can assign a target transfer degree to each account before fund-transfer events are created. When an account exceeds a hub threshold, its neighboring edge multiplicity is sampled from a configured distribution. Edge timestamps are sampled from a timestamp distribution rather than assigned uniformly. In the segmentation phase, a timeline breakpoint splits raw data into snapshot data and incremental data. The snapshot becomes the initial graph state of the system under test, while the incremental data is transformed into write queries used by the benchmark driver.
The transaction workload is organized into four query classes. Complex read queries encode investigative and risk-control patterns, such as path tracing, aggregate analysis, cycle detection, and money-flow investigation. These queries are designed to exercise multi-hop traversal, filtering, aggregation, and timeout-sensitive execution. Simple read queries perform lighter entity inspection, typically involving only a few adjacent vertices. Write queries insert, delete, or update vertices and edges. Read-write queries embed business logic inside transactions by combining read checks with subsequent writes, so that the transaction success depends on the validity of the entire workflow. This separation allows the benchmark to reflect real financial systems where analysts first query the graph, then request details for specific entities, and finally perform updates or transactional checks.
For temporal queries, the authors design patterns that apply explicit time-window filters to edges. Such queries test whether a system can improve temporal locality in storage and query execution, since recent financial data is often accessed more frequently than historical data. A representative pattern checks a direct transfer between two accounts within a window defined by startTime and endTime, then searches for indirect cycle paths through other accounts that also satisfy the same time constraints. Refer to the time-window query pattern below:
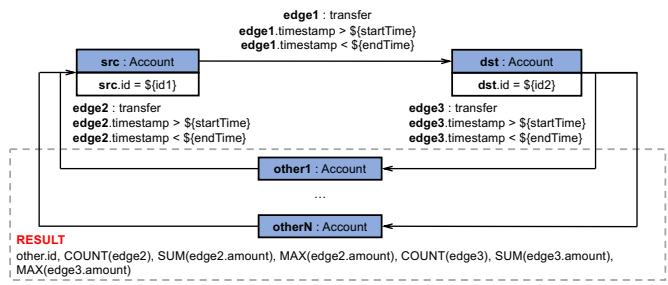
This pattern evaluates whether edge filtering can be pushed close to data access, avoiding scans over irrelevant edges. The aggregation result includes account identifiers and transaction statistics such as edge count, sum, and maximum transfer amount. The design forces the query engine to reason jointly about topology, direction, and time constraints.
Another core workload module tests recursive path filtering and hub-vertex truncation. Financial risk analysis often requires tracing fund flows through several accounts while enforcing sequence constraints on timestamps. One query pattern finds accounts linked to blocked media devices and follows transfer edges up to a bounded number of hops, requiring all timestamps along the path to be monotonically ascending. This constraint cannot be evaluated independently on each edge, because the validity of a candidate path depends on the timestamp seen at previous hops. The query also exposes hub vertices, which can contain very large numbers of adjacent edges and cause explosive search behavior. To make execution predictable, the benchmark introduces truncation parameters, including truncation order and truncation limit. These parameters define which edges are considered first and how many are traversed, acting as a deterministic sampling mechanism for hot vertices. Refer to the recursive path filtering and truncation pattern below:
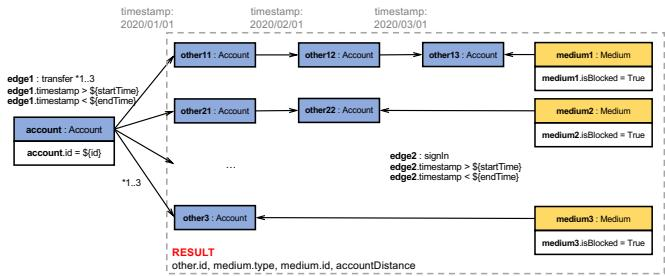
A baseline execution strategy would first materialize many candidate paths and then scan each path to verify the recursive filter. That approach creates large intermediate result sets and wastes memory. The authors instead describe an optimization that maintains a traversal state during path expansion. For a filter such as ascending timestamp order, the state tracks the maximum timestamp seen so far. Each newly considered edge is accepted only if its timestamp exceeds that state value. This converts a post-path filter into a pre-path pruning filter, reducing invalid traversals before they grow into full candidate paths.
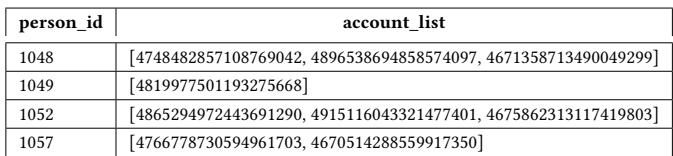
Parameter generation is another important module in the benchmark pipeline. Financial graphs often follow power-law distributions and strong temporal dependencies, so random parameter selection can produce unstable intermediate result sizes and unreliable runtime measurements. To address this, the authors combine factor tables with iterative edge-level processing. A factor table records entity relationships and statistical buckets, such as the accounts owned by each person, outgoing transfer edges per account, and transfer counts bucketed by transaction amount. These buckets prevent high-volume and low-value accounts from dominating query execution unpredictably. The generator then walks the query pattern hop by hop and applies truncation filters using the factor tables. A greedy selection process chooses parameter values that yield balanced result sizes and stable execution times. Refer to the parameter curation pattern below:
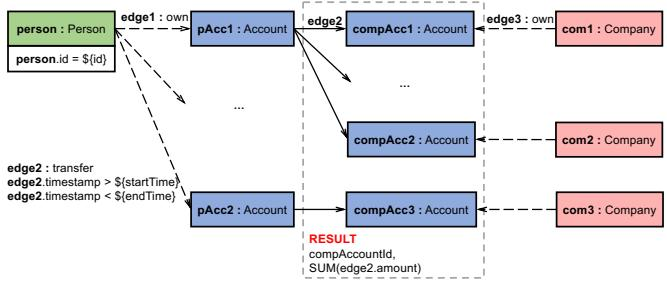
This approach is useful for queries that begin with a person, traverse accounts, and finally inspect company accounts connected through transfers. Because truncation is applied at multiple traversal steps, the parameter generator can better estimate intermediate result sizes and reduce variance caused by hub vertices.
The authors also design a workload mixing mechanism that connects complex and simple read queries. Complex read queries form the analytical core of the workload and produce results that can become inputs for simple inspection queries. To approximate this behavior, the driver generates a variable number of simple read queries after complex queries. The number is controlled by a time-window-biased random process. Let U be a uniform random variable in the interval [0,1), let t be the time-window length used by a complex read query, and let k be a tuning coefficient. The probability value is computed as:
Prob(x)=1−Uk⋅tThis value maps the complex query time window to a scaled random signal that determines how many simple read queries are triggered. Longer time windows increase the expected number of follow-up simple reads. This mechanism preserves realistic workload interaction while keeping the generated mix controllable and reproducible.
Write and read-write query generation preserves business ordering. Account creation must occur before transfers that reference those accounts. Transfer relationship creation must occur after the involved entities exist. Update operations modify entity state after the entity has been created or read. The data generator assigns creation timestamps to simulated vertices and edges during simulation and maps them to relative timestamps in the incremental write stream. At benchmark execution time, the driver compresses or expands the timeline using a configured load factor, then emits write operations according to the relative timestamps. This makes the update stream consistent with the lifecycle of the entities already present in the snapshot graph.
The benchmark also targets storage-layer optimizations through temporal access patterns. A system can improve time-window filtering by organizing adjacent edges in timestamp order inside storage. One example design packs graph topology into a key-value store, where a vertex identifier is the key and the outgoing and incoming edge identifiers are packed as the value. Each edge identifier encodes source vertex, edge label, temporal identifier, destination vertex, and multiplicity support. The temporal identifier is the key field that enables timestamp-ordered edge lists. When edges are stored in timestamp order, the engine can use binary search to locate the first edge after startTime and then iterate until endTime is exceeded. Refer to the packed graph topology below:

This representation reduces unnecessary edge scans and improves cache and memory page locality for temporal queries. The design also shows how edge multiplicity and label information can be preserved while still supporting ordered access by time. Together, the generator, query classes, parameter curation, workload mixing, and storage-oriented query patterns form the core methodology of the financial benchmark.
Experiment
FinBench constructs configurable financial graph datasets and a transaction workload containing complex reads, simple reads, writes, and read-write queries to exercise system throughput, latency, on-time compliance, and ACID behavior. On TuGraph, experiments validate that timestamp-sorted storage improves temporal access locality and that state-aware recursive path filtering prunes invalid traversals, while standard graph query languages still struggle to express truncation and recursive filtering concisely. End-to-end runs on Galaxybase and gStore demonstrate portability and completeness, but the comparatively high latency of recursive path filtering queries identifies it as a key optimization opportunity.
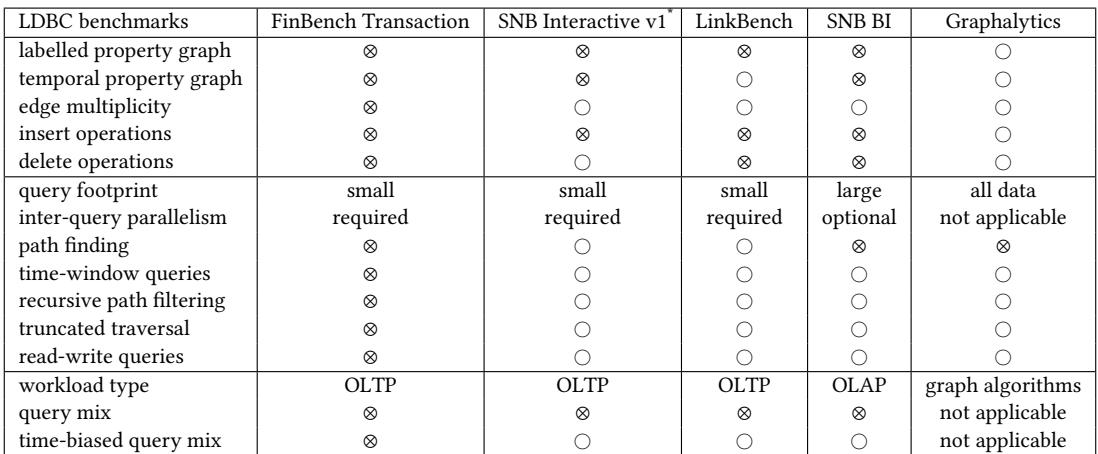
The table compares graph benchmarks for workload and schema traits relevant to financial transactions. FinBench is shown to support a labelled temporal graph model, edge multiplicity, and both insert and delete operations, while the compared benchmarks cover these traits unevenly. Graphalytics appears the least transactional in this comparison, with limited schema features and no applicable inter-query parallelism. FinBench combines temporal graph features, edge multiplicity, and update operations that are absent from several compared workloads. Graphalytics does not show insert or delete update operations and marks inter-query parallelism as not applicable.
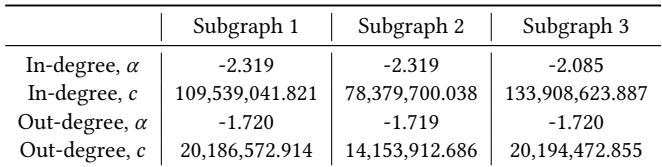
The sampled financial subgraphs show heavy-tailed power-law degree distributions for both in-degree and out-degree. Out-degree behavior is very stable across subgraphs, while in-degree behavior varies somewhat but still indicates strong skewness. Differences in normalization constants suggest that subgraph scale affects the magnitude of the fitted distribution, but not the overall power-law shape. Out-degree power-law exponents are nearly the same across all three subgraphs. In-degree power-law exponents are less stable, indicating some variation in the in-degree skewness. Normalization constants differ notably between subgraphs, reflecting scale or population differences rather than a change in the underlying heavy-tailed pattern.
The table illustrates person-to-account mappings used as factor-table data for generating and curating parameters in a financial graph benchmark. These mappings support traversal of account relationships and help control intermediate result sizes for performance-sensitive queries. The varying account list lengths reflect skewed entity connectivity that can affect query workload behavior. Person identifiers are associated with account lists ranging from a single account to multiple accounts. Account-list relationships enable multi-hop traversal from persons to linked accounts as intermediate query results. Using such factor tables supports parameter curation intended to produce more balanced and reproducible benchmark queries.
Enabling temporal sorting in TuGraph-DB noticeably improves performance for a temporal financial query on SF100. The feature reduces both edge iteration time and total query execution time, with edge iteration showing a larger relative gain. This suggests that time-ordered edge access helps avoid costly full scans over randomly ordered edges. Temporal sorting improves temporal access locality for time window filters. Edge iteration time drops substantially more than overall query execution time. TCR 1 benefits from ordered edge storage when timestamps are used as query predicates.

The optimized recursive path filtering approach reduces average query execution time across three FinBench recursive path filtering queries. Pushing the filter into traversal to prune invalid paths improves performance substantially over the baseline for TCR1, TCR2, and TCR5. The method shows broad benefit, with the strongest relative improvement on TCR2 and still large gains on the other queries. Optimized recursive path filtering executes much faster than baseline across TCR1, TCR2, and TCR5. TCR2 shows the largest relative execution time reduction among the evaluated recursive path filtering queries.
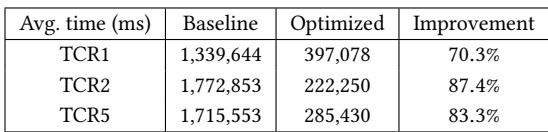
The experiments evaluate FinBench by comparing its workload and schema traits with existing graph benchmarks, analyzing financial subgraph degree distributions and account mappings, and measuring query-level optimizations in TuGraph-DB. These analyses validate FinBench's coverage of labelled temporal graphs, edge multiplicity, and update operations, while showing that financial subgraphs exhibit realistic heavy-tailed degree distributions and skewed person-to-account connectivity. Performance results further indicate that temporal edge sorting and recursive path-filtering pushdown substantially improve execution efficiency, especially for time-window filters and recursive queries.